Basically, this chart.
I admit, the title's a bit misleading, since I'm focusing down on Slovenia and Croatia specifically (the other republics drag it down to between Hungary and Poland, though still on track to beat them before the stagnation).
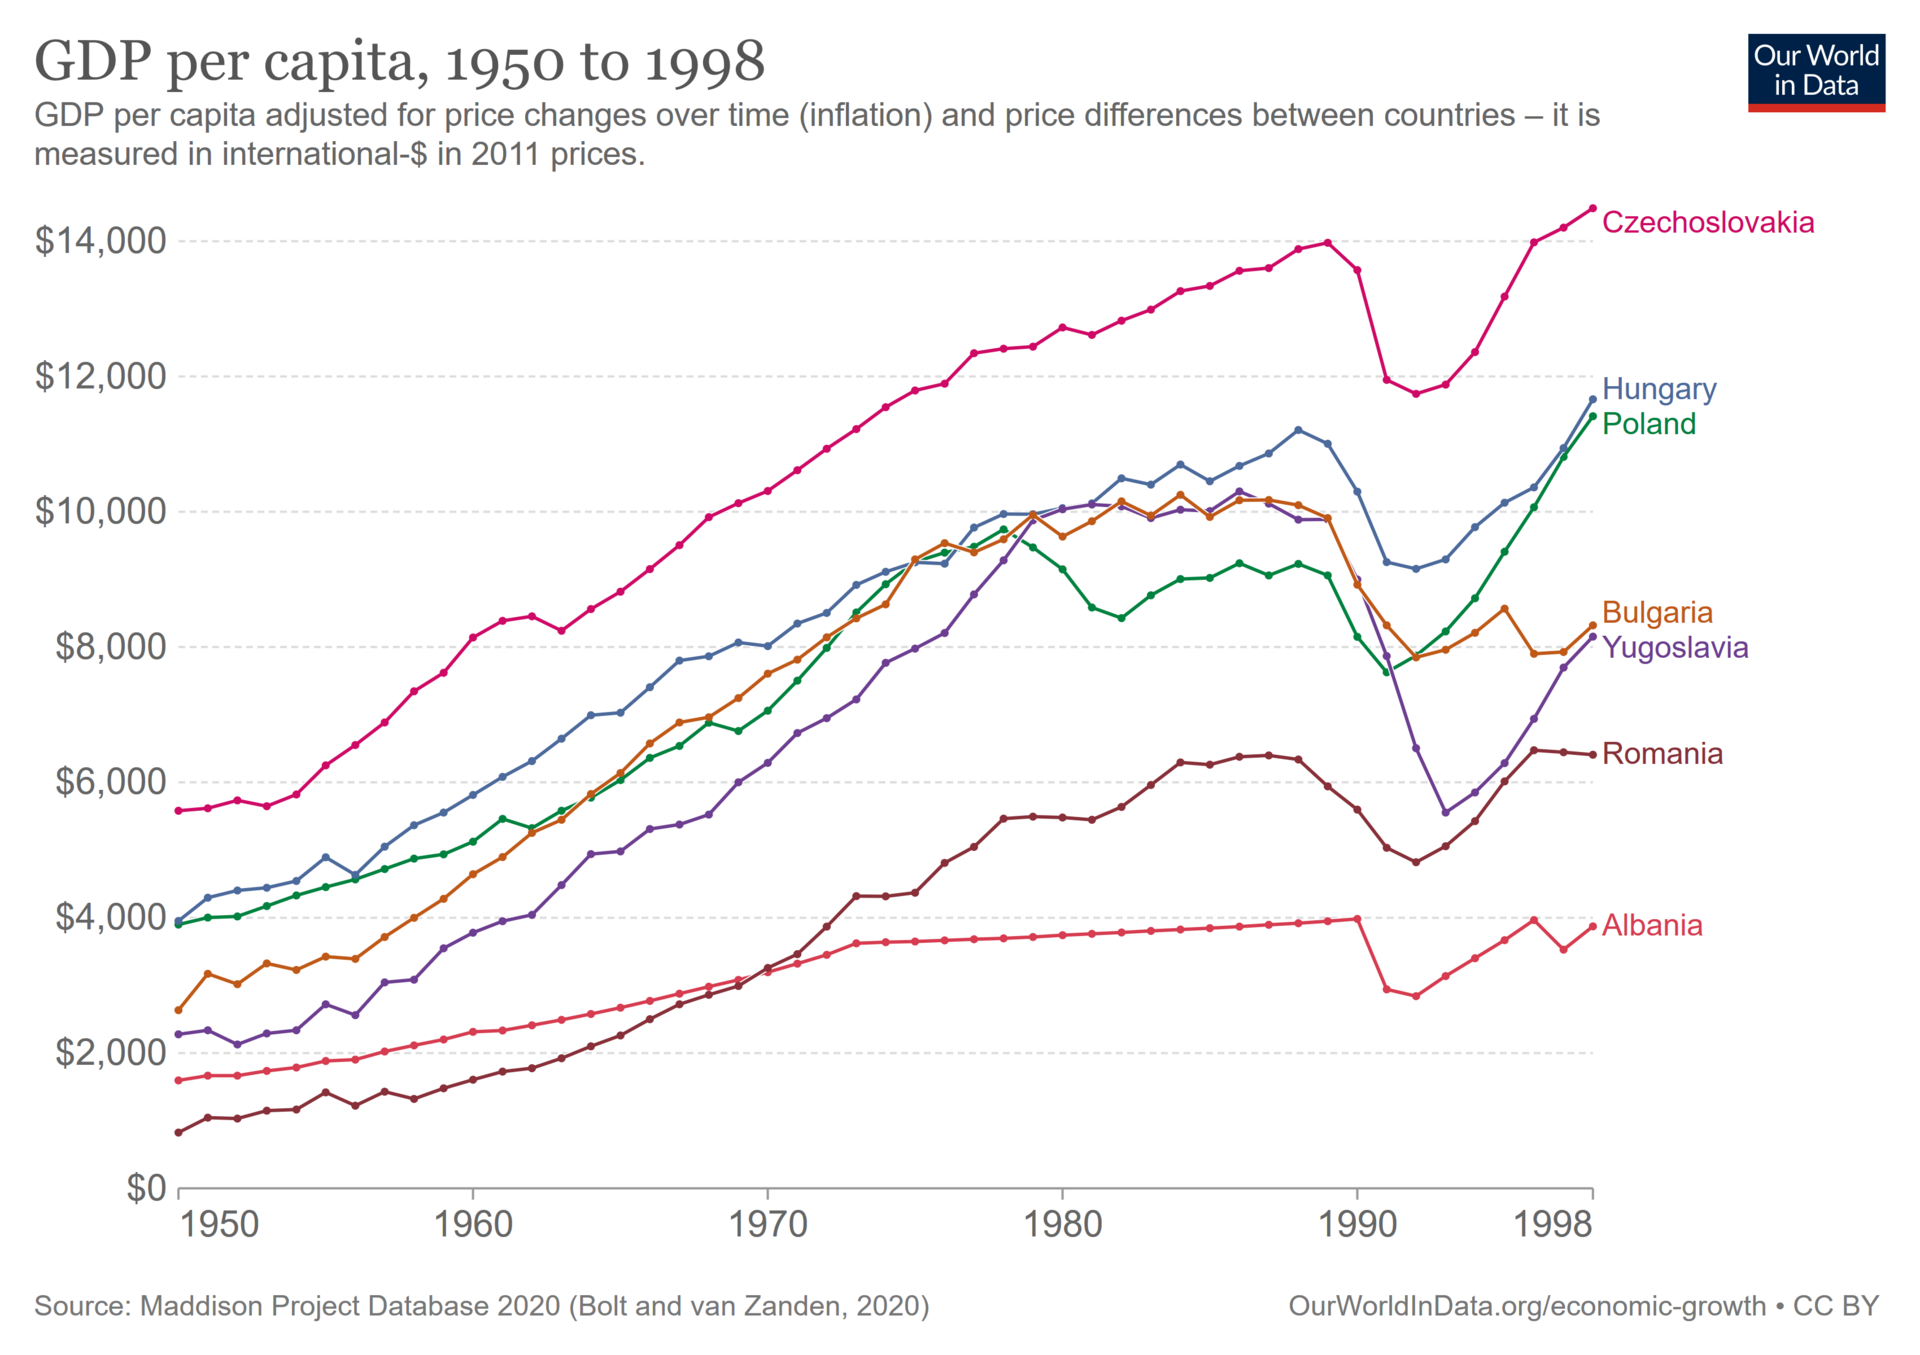
What's going on here? I know that the "Real Existing Socialism" countries were infamous for their stagnation and lower living standards, and you can see that on the chart, with the Warsaw Pact countries barely keeping up with the UK, then starting to stagnate and fall behind in the late 70's onward, forming the bottom of the chart. But with Slovenia and Croatia, the two richer Yugoslav republics, you can see both of them not just keeping up, but catching the West until austerity kicks in in the 80's, and according to this chart, Slovenia even overtakes the UK and Japan in '79. Japan! During it's economic miracle!
As I understand it, they kept heavily subsidizing and bailing out inefficient enterprises, and not threatening them with bankruptcy, and kept printing money and getting more IMF loans, so they suffered from high inflation, unemployment, and eventually the economy tanked when the IMF made them do austerity to renegotiate their debt, after Western import demand collapsed after the oil crisis, so I assume that their "miracle" would be more modest if they sorted that out to be more sustainable, but still, why do they stand out above the Warsaw Pact countries?
I've tried to do some research as to why this happened, and I've read some stuff talking about guest workers not being counted properly, unsustainable IMF loans, soft budget constraints, more industrialized starting position, price controls, and a whole lot of other stuff, and I suspect that there's some number fudging here, but I don't know what to make of it all. Does anyone here know more about this than me? Why is this like this?
Thanks!
Last edited: